

Another record has been broken.
Another hottest month. Another hottest ocean. Another heat wave that would have been extraordinarily unlikely without climate change. Another drought. Another wildfire season. Another chart whose line suddenly shoots above everything that came before it.
So many records are being broken so often, I often worry the public is becoming numb to the message and the urgency of confronting this crisis.
So let’s strip away the charts for a moment and talk about what actually matters.
The planet is extremely hot right now. The oceans are even more alarming. And one of the strongest El Niño events scientists have ever observed is developing on top of all of it.
That last part is important, because El Niño isn’t causing climate change.
Think of climate change as steadily raising the floor beneath us. El Niño is temporarily jumping on top of the roof.
And that combination could make the next year extraordinary.
Climate Central scientist Dr. Zachary Labe summed up the situation today:
“Another day, another record, as average global sea surface temperatures continue to shatter new record daily highs. Until we reduce carbon pollution, these record-breaking headlines will continue, and the impacts on communities and ecosystems around the world will only grow worse.”
He’s not exaggerating.
The headline: July was brutally hot
July 2026 tied 2024 for the warmest July ever recorded globally, combining temperatures over land and ocean.
Modern record-keeping began in 1850.
The four most recent Julys are now the four hottest Julys ever recorded.
The Northern Hemisphere had its hottest July on record. So did North America.
And Africa.
And Asia.
For the contiguous United States, July wasn’t merely the hottest July on record — it was the hottest July ever recorded.
That record had stood since July 1936, during the Dust Bowl.
But there is an important difference between 1936 and today.
The Dust Bowl produced extraordinary regional heat across the central United States, intensified by drought and disastrous land-management practices.
Look at the planet today and the heat isn’t confined to one region.
It’s everywhere.
As Labe explained during Climate Central’s briefing, the comparison between 1936 and 2026 illustrates the difference between an extreme regional event and a planet whose entire temperature baseline has shifted.
That is the part that gets lost when every summer produces another headline about another record.
The record itself isn’t the story anymore. The trend is.
I’ve written about this problem before at Mesoscale News: climate statistics can become so enormous and so repetitive that they begin to feel abstract. When I wrote about the staggering financial toll of weather disasters in The New Normal Is $115 Billion a Year, I made the same point.
Records broken again. Billions lost again. Another disaster. Lives lost. Wash, rinse, repeat.
The oceans are the story to watch
If there is one chart I would tell everyone to watch right now, it isn’t air temperature.
It’s ocean temperature.
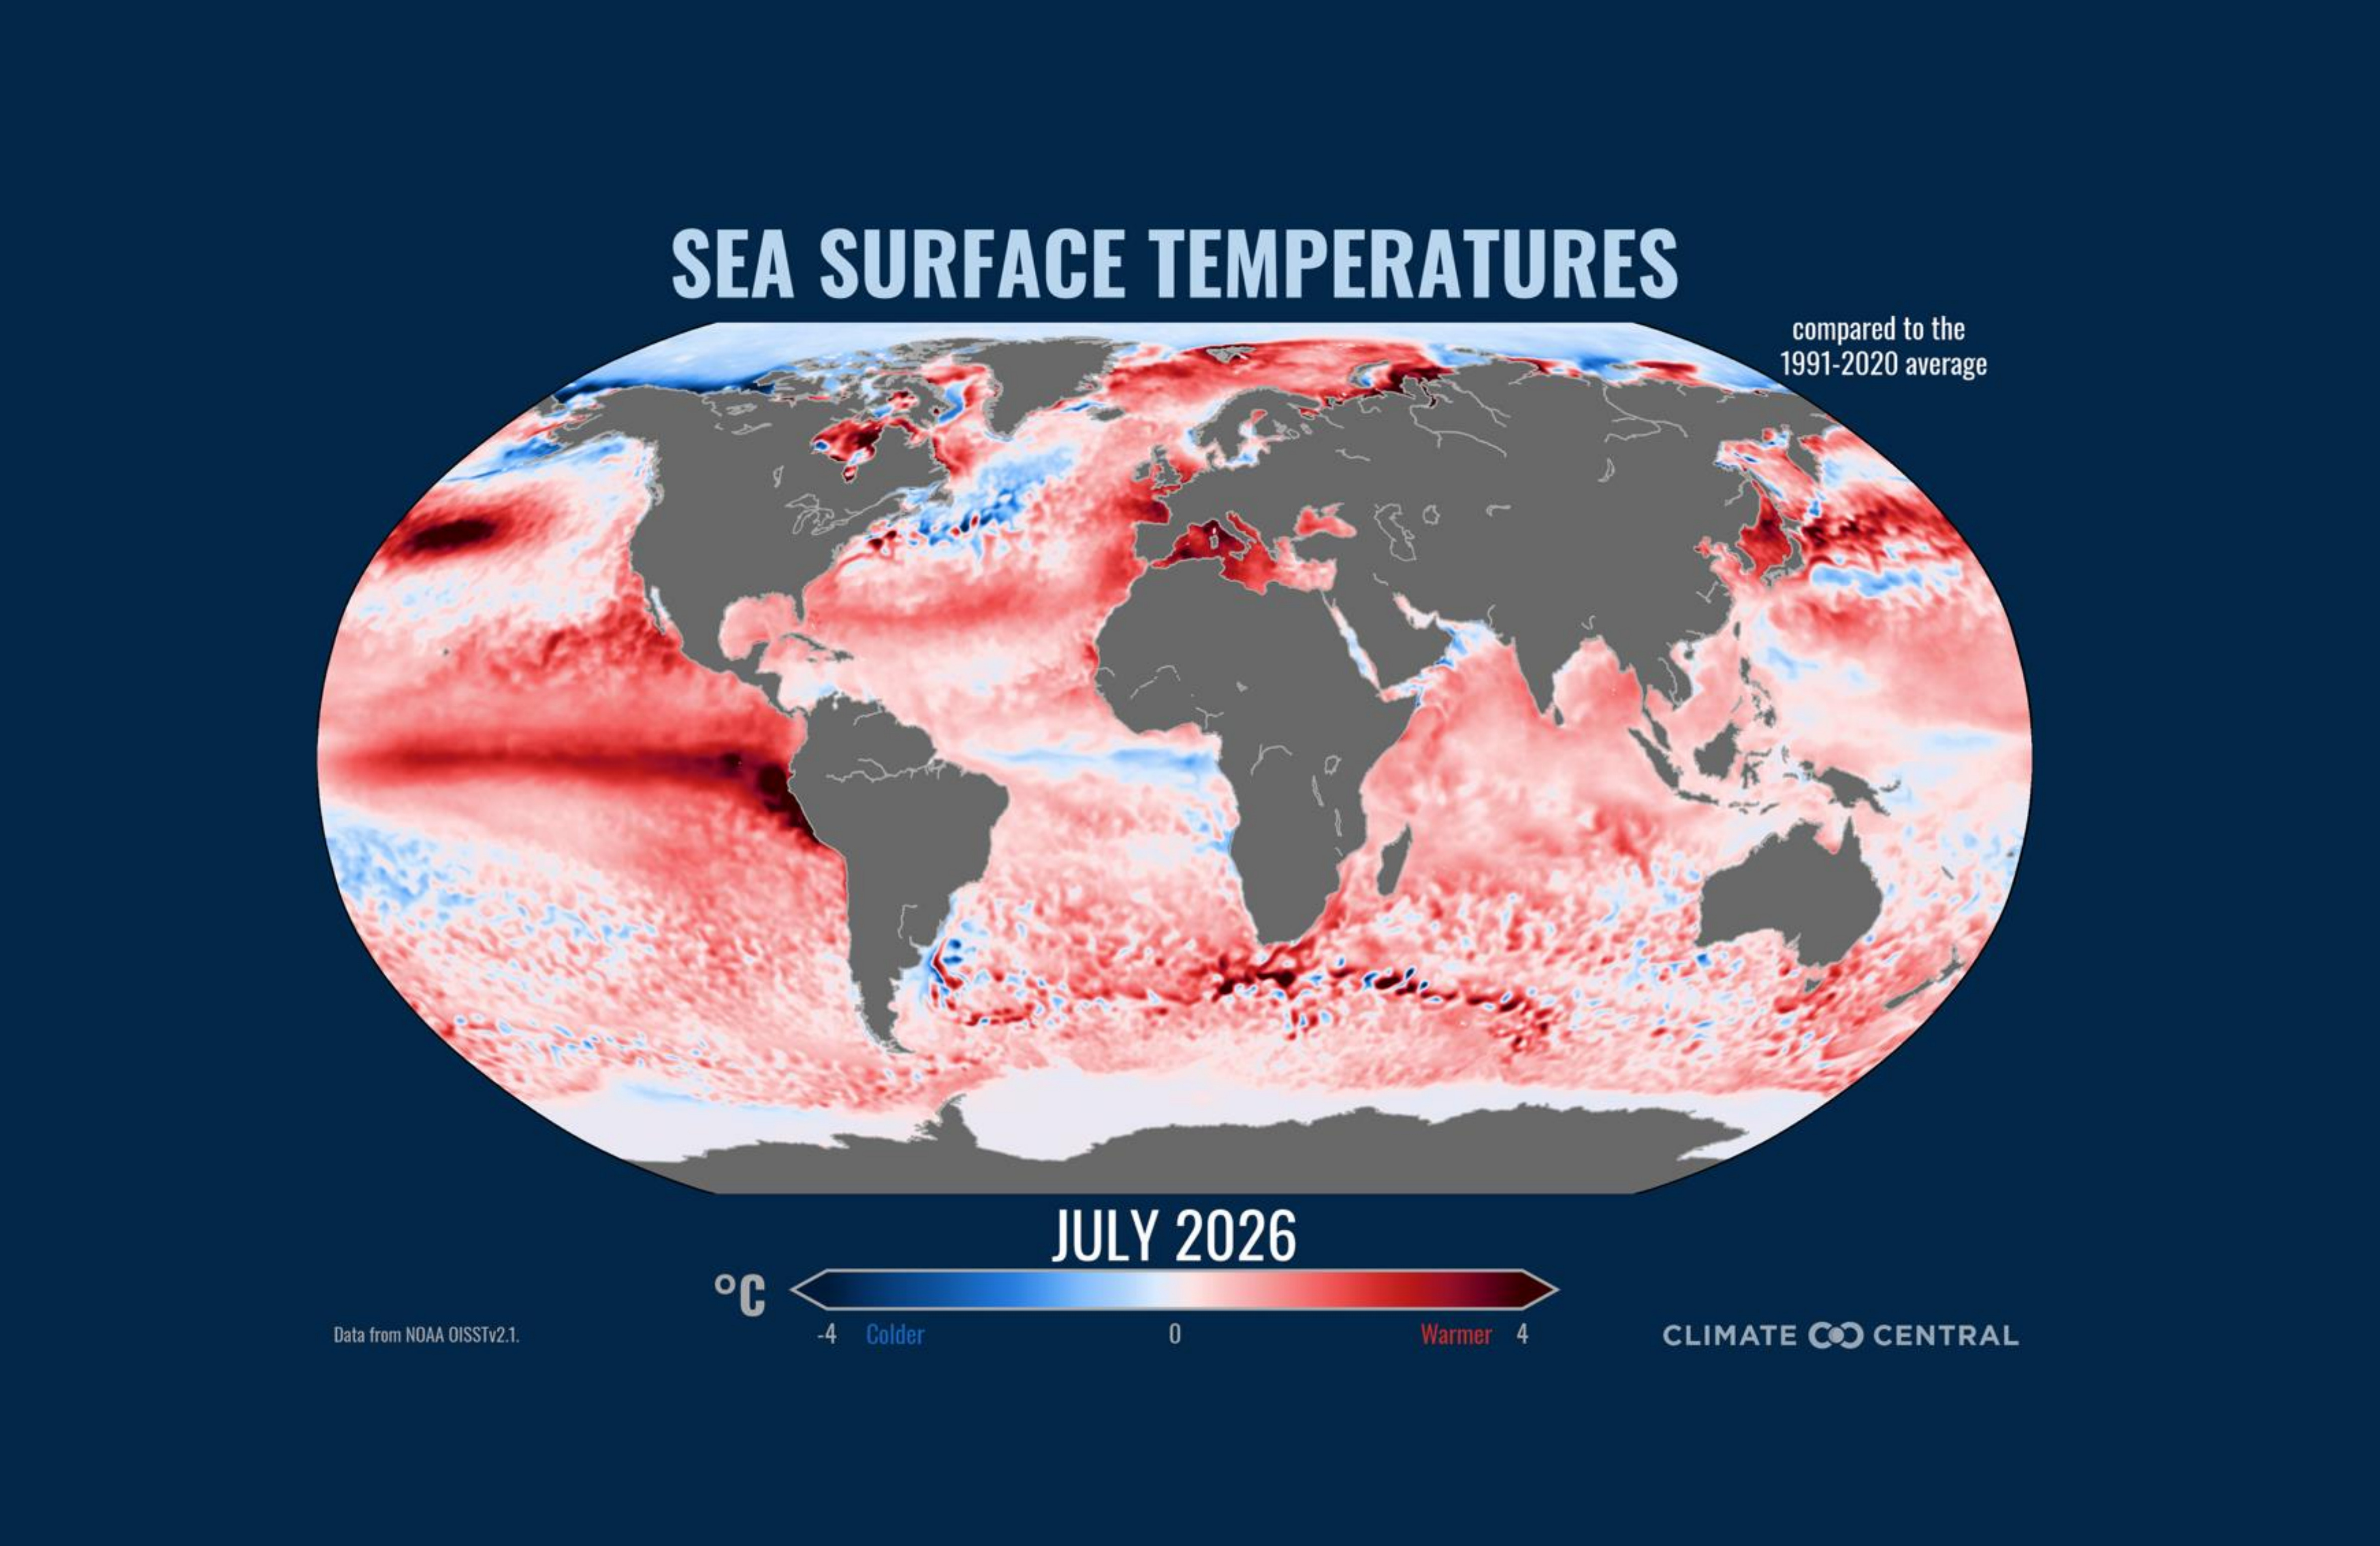
Global ocean temperatures were the warmest ever recorded for July.
And this isn’t a one-month anomaly.
Beginning around 2023, global sea-surface temperatures shifted sharply upward. In 2026, they began setting daily records again in early June.
By early September, if the streak continues, the world will approach 100 consecutive days of record global sea-surface temperatures.
And the heat isn’t confined to the surface.
Measurements of ocean heat extending down roughly 2,000 meters (more than a mile) also reached record levels earlier this year.
That matters because the ocean is Earth’s great climate battery.
It absorbs the overwhelming majority of the excess heat trapped by greenhouse gases. Warmer oceans affect coral reefs, marine ecosystems, atmospheric moisture, rainfall, tropical cyclones and coastal temperatures.
We have already seen what that looks like.
A buoy in the western Mediterranean recorded water around 91°F this summer, setting a basin record amid an extraordinary marine heat wave.
Meanwhile, waters in the Gulf of Mexico have again climbed into the upper 80s, with some areas above 90°F. Developing El Niño conditions can suppress Atlantic hurricane activity by increasing wind shear, but exceptionally warm water remains fuel for any storm that finds favorable atmospheric conditions.
This is the strange climate world we now inhabit:
One climate pattern may reduce the odds of storms forming while climate change increases the amount of energy available to the storms that do.
And now comes El Niño
Here’s the simplest explanation of El Niño: Every few years, a large area of the tropical Pacific becomes unusually warm.
That ocean warmth interacts with the atmosphere, altering winds, rainfall and weather patterns around the world.
Some places become wetter.
Some become drier.
Some become warmer.
Agricultural regions can see rainfall shift at precisely the wrong time. Flood risks can increase in some places while drought and wildfire risks increase somewhere else.
And because an enormous area of the Pacific is releasing additional heat into the atmosphere, global average temperatures tend to rise during El Niño years.
Normally, that is temporary.
The problem is that El Niño is no longer occurring on the climate of 1950, 1980 or even 2000.
It is occurring on top of decades of human-caused warming.
And the El Niño developing right now looks exceptional.
NOAA’s latest outlook puts the probability of this event becoming “very strong” at roughly 95 percent.
More strikingly, NOAA estimates a 69% chance that it becomes stronger than any previous El Niño in the agency’s record dating to 1950.
That doesn’t mean there is a 69% chance of disaster.
It doesn’t mean California is guaranteed catastrophic flooding or Australia is guaranteed drought.
And despite the phrases you may see floating around social media — “Super El Niño,” “Godzilla El Niño,” and whatever inevitably comes next — those aren’t scientific classifications.
The scientifically important phrase is very strong.
And scientists are increasingly confident that is where we’re headed.
Climate change loaded the dice. El Niño is rolling them.
This distinction matters enough to repeat: El Niño is not responsible for the long-term warming of Earth.
Human-caused greenhouse-gas pollution is.
Climate change has raised the starting temperature from which El Niño operates.
Labe described it well: the long-term rising trend is climate change; El Niño provides an additional boost.
That’s why blaming the coming records on El Niño gets the science exactly backward.
Without human-caused warming, El Niño would still temporarily warm the planet, but it would be jumping from a much lower platform.
Instead, Earth’s average temperature in early August was hovering around 17°C (62°F).
That number probably sounds pleasantly mild because it’s an average of everything from Antarctica to the Sahara.
For comparison, the normal seasonal peak during the 1991–2020 climate period was about 16.3°C.
The current all-time daily record, set in July 2024, is about 17.2°C.
We are already hovering close to it.
And El Niño hasn’t peaked yet.
2027 is where things get especially interesting
So far, 2026 ranks around the third-warmest year on record globally, depending somewhat on the dataset.
That may change as El Niño strengthens.
Climate models currently project global temperature anomalies rising over the next six to twelve months, with the multi-model average reaching around 1.7°C above the 1850–1900 preindustrial baseline around February 2027.
Individual models span a wider range, roughly 1.4°C to 2.2°C.
That does not mean the Paris Agreement’s 1.5°C threshold has permanently been crossed. The Paris target refers to long-term warming, not an individual month or year temporarily pushed higher by natural variability.
But it does tell us something extremely important about where the climate system is heading.
During his presentation, Labe was cautious about declaring 2026 the hottest year ever.
About 2027, he was considerably less cautious.
His assessment: 2027 will “probably most certainly” break the record.
That should get our attention.
The disasters are already here
None of this exists only on a climate graph.
More than 200 million Americans experienced temperatures around the July Fourth period that Climate Central found were made at least three times more likely by human-caused climate change.
Another major July heat wave exposed nearly half the contiguous United States to temperatures made at least five times more likely by climate change.
Salt Lake City reached 109°F, breaking its all-time temperature record.
July’s average temperature across the contiguous United States surpassed the Dust Bowl record from 1936.
Warm nighttime temperatures were especially extraordinary — an underappreciated danger because bodies, homes, and infrastructure need nighttime cooling to recover from daytime heat.
As Labe explained, when nights remain hot, our bodies lose that recovery period. Heat stress accumulates.
And then there is drought.
By mid-August, nearly half the contiguous United States was experiencing at least moderate drought, with portions of the West experiencing conditions comparable on some measures to the Dust Bowl era.
Dryness and extreme heat have helped create favorable conditions for major wildfires across western North America.
Thousands of miles away, Indonesia is already confronting its own El Niño-amplified fire danger. Drier conditions have fueled wildfires in Kalimantan, including fires that recently threatened an orangutan rehabilitation center.
This is why I keep coming back to disasters in my reporting here.
Whether we’re talking about hurricanes, wildfires, heat waves, coral bleaching, drought or the enormous financial losses I’ve documented previously, these aren’t separate stories.
They’re different expressions of the same changing system.
Your grocery bill may eventually notice, too
El Niño doesn’t only appear on weather maps.
It appears in commodity markets, too.
Reuters reported this week that a very strong El Niño is raising concerns about cocoa, coffee, and sugar production.
West African cocoa can be damaged by El Niño-related shifts between excessive rain and hot, dry conditions. Robusta coffee production in Vietnam and Indonesia is vulnerable to heat and drought. Sugar production can be disrupted by rainfall changes across Brazil, India and Thailand.
That doesn’t mean El Niño automatically makes your coffee more expensive.
It means climate variability is colliding with a warmer planet and an interconnected global food system.
A drought in Vietnam can eventually appear in a supermarket in Virginia.
Climate change has never respected borders.
Neither does El Niño.
We know enough to prepare
There is one piece of this story that deserves more attention.
Scientists aren’t merely watching these changes happen.
They’re trying to turn forecasts into warnings people can actually use.
The World Meteorological Organization is working with national meteorological agencies to improve what it calls heat services: warning systems and climate information designed around the actual risks heat poses to human health, infrastructure and communities.
And there is a lot of work left to do.
In survey data presented during Climate Central’s briefing, only about a third of responding meteorological services said their forecasters were trained in impact-based forecasting — warnings that explain not simply how hot it will be, but what that heat is likely to do to people.
Only about 30%reported having mechanisms for user feedback, and just 22% had access to cross-sector impact information and post-heat-wave analytics.
Those numbers should improve quickly.
Because the climate we built our infrastructure, warning systems, insurance markets, electrical grids and emergency plans around is disappearing.
And the next year may provide an unusually stark demonstration of that.
This is the climate story now
There will be endless arguments over whether a particular hurricane was “caused” by climate change.
Whether one flood was caused by El Niño.
Whether one wildfire would have happened anyway.
Those questions are understandable, but they often miss the larger point.
Climate change doesn’t need to personally light every match.
It changes the room the match is struck in.
It raises temperatures.
It warms oceans.
It changes evaporation and atmospheric moisture.
It increases the likelihood and severity of some extremes.
It shifts the baseline against which natural cycles like El Niño operate.
And now one of the strongest El Niño events in the historical record may be developing on top of the hottest oceans humanity has measured.
That is the headline.
Not that El Niño is causing global warming.
Not that every disaster this winter will be caused by El Niño.
The headline is that a powerful natural climate cycle is arriving on a planet we have already made dramatically warmer.
We have never experienced this particular combination before.
And we’re about to find out what it looks like.
Mesoscale News exists to make science like this understandable without stripping away the complexity or turning every climate story into clickbait. I read the datasets, scientific briefings, government forecasts and research so you don’t have to — and then connect those numbers to what they actually mean for people.
If that kind of independent science reporting is valuable to you, please consider upgrading to a paid subscription. Paid subscribers make it possible for me to keep doing this work without a corporate newsroom deciding which climate stories are worth your attention.